The yield curve is one of the most important indicators of the health of the economy. It is a chart that shows the relationship between the yields on different maturities of Treasury bonds. When the yield curve inverts, it means that the yields on shorter-term bonds are higher than the yields on longer-term bonds, which is a sign of an impending recession.
Recently, the 10-year Treasury note dipped 5 basis points to 3.58%, and the 2-year note slid 2 basis points to 4.43%, signaling a potential inversion of the yield curve. This has caused concern among investors, as an inverted yield curve has historically been a reliable indicator of a looming recession.
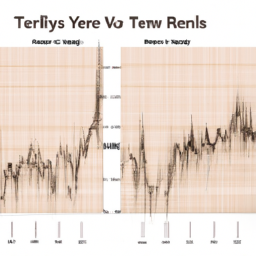
Below is a long-term chart of the yield spread between the ten-year Treasury note and the two-year Treasury note. This spread is known as the “yield curve inversion”, and when it is negative, it signifies an inverted yield curve.
The chart shows that the yield curve inversion began in mid-October and has continued to this day. This is a sign that the economy may be headed for a recession.
The yield curve inversion is also a sign that the Federal Reserve may be losing control of the economy. When the 3-month Treasury bill yields more than the 10-year Treasury note, it is a sign that the Fed is no longer able to keep interest rates low. This may put further pressure on the economy, as the Fed is no longer able to provide economic stimulus.
The inversion of the yield curve has also had a negative effect on the stock market. The S&P 500 has reversed its gains and is now headed for a bear market in 2022. This is a sign that the economy may be headed for a recession.
The yield curve inversion may also have an effect on commodities, such as oil and gold. As investors become more risk-averse, they may begin to favor commodities over stock. This could lead to an increase in the price of commodities.
In order to prepare for the potential recession, investors should be aware of the yield curve inversion and the potential implications for the stock market, commodities, and the economy as a whole.